Globe & Mail Canadian Fiction Bestsellers Analysis
Problem: For the CDPB100: Publishing Overview - Trade course in the Publishing Certificate program at Toronto Metropolitan University, I was required to complete an assignment analyzing the Canadian Fiction market using two weeks of Globe & Mail Canadian Fiction Bestsellers.
Solution: I decided to compile the bestseller lists into a spreadsheet where I could analyze and visualize the data to develop a better understanding of trends in the rankings. The spreadsheet is downloadable via this link.
Excel Process
I began by pulling the Globe & Mail Canadian Fiction Bestsellers lists for the weeks of February 17 and February 24 into a sheet to compile both rankings in one table that I would be using for all future Pivot Tables. From there, I created a separate sheet to compile data about the individual titles such as primary and subgenres, author record (if they had published previously or not), and the publisher. The Globe & Mail’s Bestsellers lists categorize titles by the imprint they were published, so I added additional columns for the parent publisher and whether or not the publisher was a “Big 5.” To automate the “Big 5” column, I created a Data Reference sheet with a small table of the Big 5 publishers and used a CountIf function to determine if the title’s publisher was within the list of Big 5 publishers, and nested that within an If function to return a value for true (“Big 5”) and false (“Not Big 5”).
Once the Book Data sheet was complete, I used VLookup functions to pull that data into the Bestsellers Lists sheet. While there is a lot of overlapping data in the two sheets, I used separate sheets for this process to ensure the title metadata would remain correct and consistent if changes had to be made (changing one row in the Book Data sheet leaves less room for error than changing multiple rows in the Bookseller Lists sheet).
Additionally, in the main bestsellers data table I used the formula DatedIf to determine the number of days between the date of release and the week the title appeared on the bestsellers list. I converted those days into weeks (since the DatedIf function doesn’t recognize weeks as a unit) by dividing the result by 7 and wrapping the equation in a Round formula with 0 digits to return a whole number. I also created another reference sheet with a list of all of the weeks a title from February 17 and February 24 made the Canadian Fiction Bestsellers list and where that title ranked for that week in order to calculate how many weeks each title made it on the list. This column was calculated using the CountIfs formula to count how many times a title appeared on the list where the date was prior to the date of the week entry. For example, Meet Me on the Lake was a Bestseller for 37 weeks on February 17, and for 38 weeks on February 24. It was important to make that distinction for future Pivot table data anaylsis. It was also important to create these columns in the Bestsellers table and not the Book Data table to keep all of the Pivot data in one main table and to allow me to later filter the data by week and primary genre.
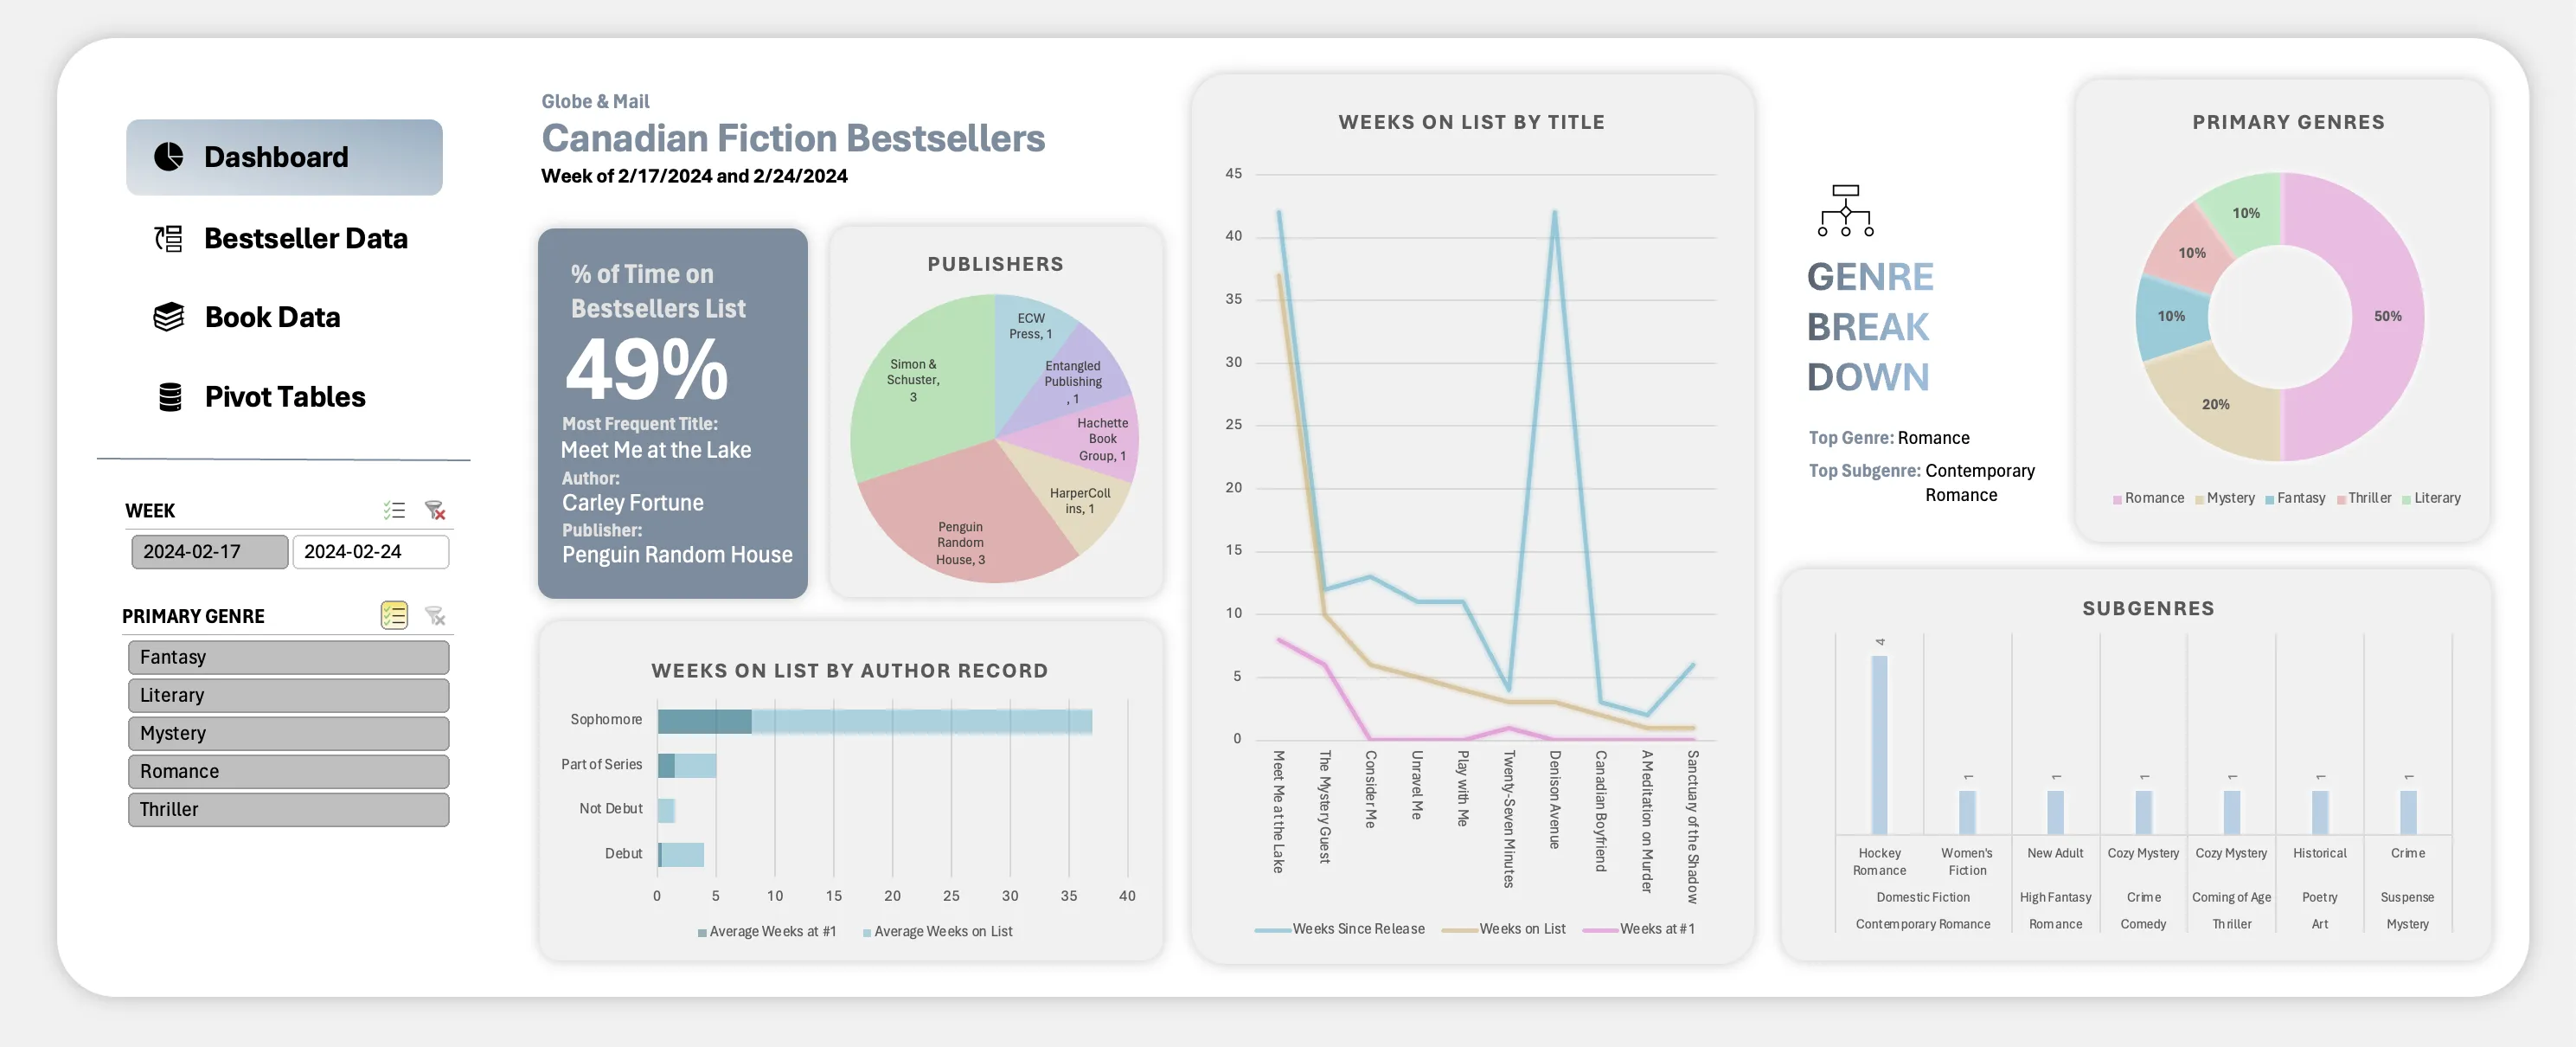
Once all of my data entry was complete, I created several Pivot Tables to calculate the breakdown of primary genres, sub genres, publishers, author record, and time spent on list which I displayed using various Pivot Charts in a data dashboard to visualize all of the important data in one interactive location. I included slicers that I then connected to all of the charts to allow for easy filtering by Week and Genre. Finally, I added a sidebar with hyperlinks to allow easy navigation between the primary data.
Findings
Ultimately, the data analysis and visualization reflected trends in the market we had discussed through the course such as the demographics of the average Canadian reader (woman, interested in genre fiction) and influence of author reach on the sell-through rates (debut authors saw less immediate success than those publishing their sophomore novel). Once those trends became clear, further research into individual authors showed that even the few debut authors had reach in other areas (for example, journalism careers or TikTok followings). Additionally, the data reflects the recent popularity of “hockey romance” as a subgenre within romance. The emergence of Becka Mack’s Playing for Keeps series (all three novels made it onto both lists within a few weeks of release) presented an interesting case study for both the important of author reach and the hockey romance trend as it was originally self-published before acquiring a deal with Simon & Schuster as a result of its popularity on TikTok.
If I were to continue my research into the Canadian Fiction market, I would be interested to see how the success of an author’s debut novel influenced the success of their sophomore novel. I would also be interested in comparing two weeks of lists from February 2023 to the lists from February 2024 to gain a better understanding of the development of trends over the course of a year.